

If you invest ₹1 lakh every month through a SIP, you are likely focused on which fund will give the best return. But there is a cost sitting inside every mutual fund — one that never shows up as a separate deduction in your bank statement, never sends you a notice, and quietly reduces what you actually keep. That cost is the expense ratio, and for a large monthly SIP, even a 0.5% annual difference can widen into a gap of tens of lakhs over 20 years.
This article is not a recommendation for any specific fund. It uses a ₹1 lakh monthly SIP as a case study to show — in rupees — how the mutual fund expense ratio impact plays out over 10, 15, and 20 years. Understanding this one concept will make you a sharper cost-aware investor, regardless of which funds you finally choose.
Quick Answer: Mutual Fund Expense Ratio Impact
Mutual fund expense ratio impact is the reduction in your SIP returns caused by annual fund management costs. In a ₹1 lakh monthly SIP, even a 0.5% yearly cost difference can create a large corpus gap over 10–20 years because the lost amount also stops compounding.
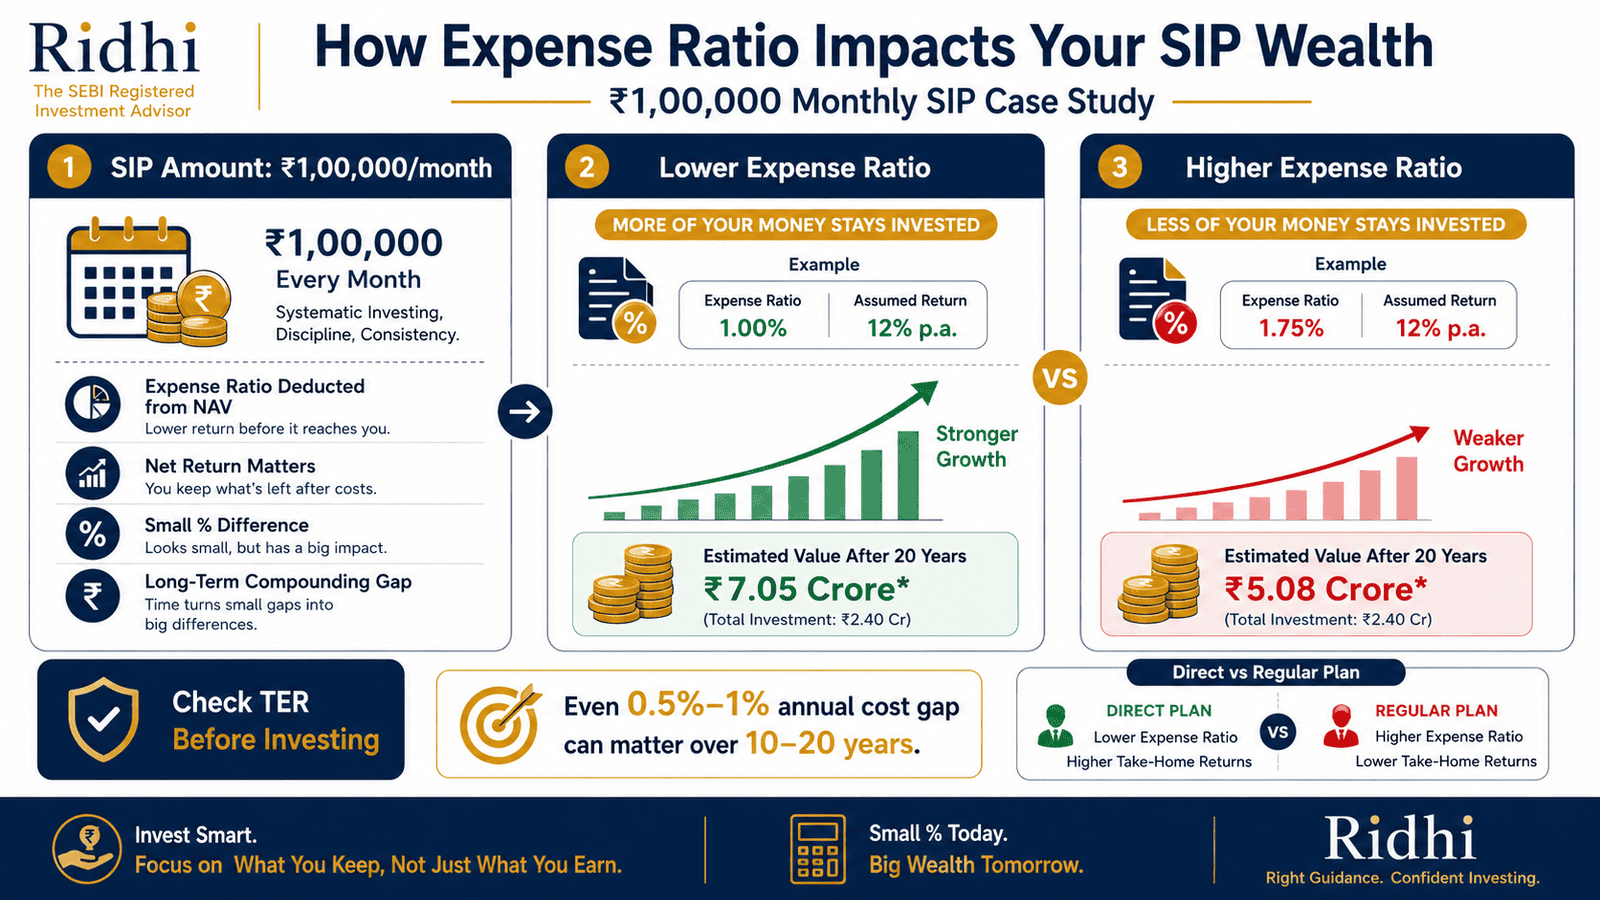
How to Calculate the ₹1 Lakh SIP Expense Ratio Impact
The calculation below uses a ₹1,00,000 monthly SIP and a gross return of 12% per year — labelled as illustrative only. The net return to the investor after expenses depends on the fund’s Total Expense Ratio (TER). Two scenarios are compared: a lower-cost fund at 0.5% TER (net return: 11.5%) and a higher-cost fund at 1.5% TER (net return: 10.5%).
Net Investor Return = Gross Fund Return − Total Expense Ratio
All figures below are illustrative. Actual returns and expense ratios vary by fund, period, and market conditions. Mutual fund investments are subject to market risks. Past performance does not guarantee future returns.
| Tenure | Lower Cost (0.5% TER, 11.5% net) | Higher Cost (1.5% TER, 10.5% net) |
|---|---|---|
| 10 years | ₹2,21,00,000 (approx.) | ₹2,07,00,000 (approx.) |
| 15 years | ₹5,07,00,000 (approx.) | ₹4,67,00,000 (approx.) |
| 20 years | ₹10,35,00,000 (approx.) | ₹9,30,00,000 (approx.) |
The gap at the 10-year mark is roughly ₹14 lakh. At 20 years, the same 1% annual cost difference compounds into a gap of over ₹1 crore — on a ₹1 lakh monthly SIP with the same underlying gross return assumption. To test different return and cost assumptions yourself, estimate SIP returns using Ridhi’s SIP calculator.
Key Takeaways
- Expense ratio is deducted from fund assets daily and reflected in the NAV you see — it is never charged separately from your bank account.
- A 1% TER difference on a ₹1 lakh monthly SIP can produce a corpus gap of over ₹1 crore over 20 years at a 12% illustrative gross return.
- Direct plans typically carry lower expense ratios than regular plans because they exclude distributor commissions — the same fund, with the same portfolio, costs less in direct.
- Expense ratio should be compared only within the same fund category: an index fund TER of 0.1% and an active small-cap TER of 1.8% serve different purposes and cannot be compared directly.
- Low cost is most decisive when two funds in the same category have similar track records, risk profiles, and fund manager quality — cost then becomes the cleaner differentiator.
- SEBI regulates the maximum TER a fund can charge; limits vary by fund type and AUM slab. Always verify the current TER from the fund’s factsheet before investing.
Key Facts at a Glance
| Parameter | What It Means | Where to Check |
|---|---|---|
| Total Expense Ratio (TER) | Annual cost expressed as % of fund’s AUM, deducted daily from NAV | Fund factsheet, AMC website |
| Direct vs Regular TER gap | Direct plans typically cost 0.5%–1% less per year than regular plans in the same fund | Check current fund factsheet — figures vary by fund |
| SEBI TER limits | SEBI prescribes maximum TER slabs by fund category and AUM size | sebi.gov.in — verify current limits before investing |
| Impact on NAV | Each day’s TER fraction is subtracted from gross NAV; you see the net NAV | Daily NAV published on AMC site and AMFI |
| Typical index fund TER | Check current fund factsheet — ranges change as AUM grows or SEBI revises limits | Fund factsheet, sebi.gov.in |
What Is Mutual Fund Expense Ratio and How Does It Work?
Every mutual fund runs on a set of costs: the fund manager’s salary, research expenses, registrar fees, custodian charges, and marketing costs. These are not billed to you separately. Instead, they are deducted from the fund’s total assets each day as a fraction of the Total Expense Ratio (TER). What you see as your NAV is already the net figure — after that day’s cost slice has been removed.
How the NAV Deduction Works
If a fund has a gross return of 12% per year and a TER of 1%, the investor’s net return is approximately 11%. The NAV published daily already reflects this deduction. You do not get a statement showing “₹X deducted as expense ratio this month.” It simply shows up as a slightly lower NAV growth compared to the gross return the fund’s portfolio actually generated. To understand how NAV works in detail, read our explainer on how NAV works.
Gross Return vs Net Return for Investors
Gross return is what the fund’s portfolio earns before costs. Net return is what actually reaches you. For a fund generating 13% gross with a 1.5% TER, your net is 11.5%. This distinction matters because fund performance data published in advertisements and factsheets is typically the net return — meaning the TER has already been subtracted. What you see is what you get, but knowing what was subtracted helps you compare funds more accurately. Understanding how mutual fund returns are measured is easier once you know the difference between CAGR and XIRR.
Why Regular Plans Cost More Than Direct Plans
When you invest through a distributor, broker, or financial platform that earns commissions, the fund includes that distributor’s commission in its TER. This is the regular plan. The direct plan cuts out the distributor — so its TER is lower. Both plans hold the exact same portfolio and have the same fund manager. The only difference is cost. According to SEBI mutual fund regulations, AMCs must disclose the TER for both direct and regular plans separately. The gap between them is typically 0.5%–1% per year, though the actual figure varies by fund and must be checked from the current factsheet.
Why Expense Ratio Differs Across Fund Categories
An index fund tracking the Nifty 50 does not need expensive research or active stock-picking — it simply mirrors the index. Its TER can be as low as 0.1%–0.2%. An actively managed mid-cap or small-cap fund requires research, analyst teams, and more frequent portfolio decisions — its TER is structurally higher. Comparing TER across these two categories without accounting for the strategy difference is not a meaningful comparison. SEBI prescribes different maximum TER ceilings for different fund categories, and the limits also change by AUM slab — verify current limits at sebi.gov.in before drawing conclusions.
Real Example: Why 1% Looks Small but Is Not
Rohan, 31, a product manager in Hyderabad, invests ₹20,000 per month. He is comparing two equity mutual funds in the same large-cap category. Both have delivered similar portfolio-level performance over the past five years. Fund A has a TER of 0.4% (direct plan). Fund B has a TER of 1.4% (regular plan). Gross return assumed: 12% — illustrative only.
In year one, the TER difference of 1% on a corpus of roughly ₹2.5 lakh costs Rohan about ₹2,500. That sounds trivial. But that ₹2,500 is not just lost — it also stops compounding. In year five, the cumulative gap is already close to ₹40,000. By year 15, the same 1% annual cost drag creates a wealth difference of over ₹6 lakh on a ₹20,000 SIP — without any difference in the underlying portfolio. This is exactly the power of compounding working in reverse when applied to costs.
Comparison: Low vs High Expense Ratio and Direct vs Regular
| Parameter | Lower Cost / Direct Plan | Higher Cost / Regular Plan |
|---|---|---|
| Typical TER range | 0.1%–0.8% (varies by category) | 0.8%–2.0% (varies by category) |
| Distributor commission included | No | Yes |
| Portfolio difference | Identical to regular plan | Identical to direct plan |
| Net return to investor | Higher (same gross, lower cost) | Lower (same gross, higher cost) |
| When higher cost may be justified | — | When investor receives ongoing advisory, goal planning, or rebalancing support worth the cost gap |
| Where to check current TER | AMC website, fund factsheet | AMC website, fund factsheet |
Choosing between direct and regular plans is not purely a cost decision — for some investors, the advisory support and hand-holding in a regular plan has real value. For an in-depth look at when each makes sense, read our guide on direct and regular plans.
How to Decide What’s Right for You
You are comparing two funds in the same category with similar 5-year track records and risk profiles — THEN expense ratio becomes the cleaner differentiator and lower cost wins.
You have a large monthly SIP of ₹50,000 or more and plan to stay invested for 15+ years — THEN even a 0.5% TER difference deserves careful attention because the rupee impact compounds significantly.
You are confident managing your own portfolio, rebalancing annually, and staying the course during market falls — THEN direct plans are worth considering for the cost saving.
You are a beginner who needs guidance on asset allocation and fund selection — THEN paying the higher TER of a regular plan through a qualified advisor may deliver more value than the cost you save.
You are comparing an index fund against an active mid-cap fund — THEN do not use expense ratio as the primary filter; strategy, risk, and return consistency matter more across categories.
You should not let expense ratio be your only fund selection criterion — a low-cost fund that consistently underperforms its benchmark is still a poor choice.
Common Mistakes to Avoid
Choosing a fund solely because it has the lowest TER
A fund with a 0.1% TER that consistently underperforms its benchmark costs you more in missed returns than a 1% TER fund that beats it by 3% per year.
Expense ratio is one filter — not the only one. Always check returns consistency, risk-adjusted performance, and fund mandate alongside cost.
Comparing index fund TER with active fund TER directly
An active small-cap fund manager is paid to research and pick 60–80 stocks. An index fund passively mirrors a benchmark with minimal decisions. Their cost structures are not comparable.
Compare TER only within the same fund category and investment style.
Ignoring the direct vs regular plan gap
Many investors invest in a regular plan and assume they are getting the same net return as direct plan investors. For a ₹1 lakh monthly SIP, a 1% TER gap means approximately ₹1,200 per month in year one — which is also not compounding for you.
Check whether your platform or broker offers direct plans and understand what you receive in exchange for the cost difference.
Assuming expense ratio is the only mutual fund cost
Exit load (a charge on early redemption), stamp duty, and capital gains tax also affect your actual take-home return. A fund with slightly higher TER but no exit load may suit a short-tenure investor better than a low-TER fund with a 1% exit load for 1 year.
Always check the full cost picture before investing.
Checking TER once and assuming it never changes
SEBI allows fund houses to revise TER within prescribed limits. A fund that had a 0.5% TER when you started may have changed. Large funds tend to have lower TER as AUM grows; smaller or newer funds may have higher TER initially.
Review the fund factsheet at least once a year during your portfolio review.
Using past return data without accounting for the TER in those periods
Published net returns already account for TER. But if a fund switched from regular to direct disclosure, or if its TER changed significantly, historical return comparisons may be misleading.
Check the scheme information document for TER history if you are doing deep research.
When This May Not Be the Right Choice
Obsessing over expense ratio can lead you to wrong decisions in certain situations. If you are comparing funds across very different categories — say, a liquid fund against an active flexi-cap fund — TER is not a relevant comparison axis. If a slightly higher-cost active fund has a distinct strategy or risk profile that matches your goal, the cost gap may be irrelevant.
For a beginner investor who needs structured advice, portfolio review, and behavioural coaching during market downturns, the cost of a regular plan may be genuinely justified — the alternative of doing nothing or panic-selling in a direct plan could cost far more. Similarly, if your bigger issue is wrong asset allocation or ignoring tax efficiency, fixing that will matter far more than saving 0.5% in TER. For a deeper comparison of fund types and their cost structures, read our guide on index versus active funds.
“If any of these apply to your situation, it may be worth exploring alternatives before committing.”
Official Rules and Where to Verify
Expense ratio rules for mutual funds in India are governed by SEBI — the Securities and Exchange Board of India. SEBI prescribes the maximum TER that a fund can charge, with different limits for equity, debt, and hybrid funds, and further slabs based on AUM size. These limits can change, so always verify the current rules directly.
- SEBI — sebi.gov.in (regulator; TER limits and mutual fund regulations)
- AMC websites — Each Asset Management Company must publish the current TER for every scheme
- Fund factsheet — Monthly factsheet published by every AMC contains the current TER
- AMFI — amfiindia.com (Association of Mutual Funds in India; daily NAV and fund disclosures)
Rules, limits, and rates on this topic can change with each Budget or regulatory update. Always verify current figures directly from the official source before making any financial decision.
Expert Tips
- When shortlisting funds in the same category, sort by TER only after you have matched for consistent returns, fund size, and manager tenure — cost is the tiebreaker, not the first filter.
- For index funds, check tracking error and tracking difference alongside TER. A fund with a 0.2% TER but a 0.8% tracking error may underperform a fund with a 0.4% TER and a 0.1% tracking error.
- For active funds, review the fund manager’s track record across market cycles, not just the last bull run. A consistent performer with a slightly higher TER may be worth more than a cheap fund with an inconsistent record.
- If you are in a regular plan, ask your advisor or platform what specific service you are receiving in exchange for the cost gap. Goal reviews, rebalancing support, and tax optimisation are legitimate value — passive order placement is not.
- Make expense ratio review part of your annual portfolio check. TER can shift as a fund grows or if SEBI revises limits. What was competitive when you invested may no longer be.
- For a ₹1 lakh or above monthly SIP, even a 0.3%–0.5% cost advantage compounding over 15–20 years is worth evaluating carefully — run your own numbers using the SIP calculator before deciding.
Frequently Asked Questions
Is expense ratio charged separately from my bank account?
No. You will never see a separate deduction for expense ratio in your bank statement. The fund deducts a tiny fraction of the TER every business day from the fund’s total assets, which reduces the NAV marginally. You see only the net NAV — after that day’s cost has been removed.
Does a lower expense ratio always mean better returns?
Not necessarily. A lower TER reduces the drag on returns, but actual performance depends on the portfolio decisions of the fund manager, market conditions, and the fund’s strategy. Two funds can have the same TER and very different returns, or very different TERs and similar returns. TER is one component of the return equation, not the whole picture.
Why is the regular plan expense ratio higher than direct?
Regular plans include a distributor commission paid to the broker, advisor, or platform that sold you the fund. Direct plans have no distributor in the chain, so that commission component is absent — resulting in a lower TER. The fund’s portfolio, fund manager, and underlying investments are identical in both plans.
How often does a mutual fund’s expense ratio change?
A fund’s TER can change periodically. SEBI allows AMCs to revise TER within the prescribed maximum limits. Typically, as a fund’s AUM grows, the TER tends to decrease because fixed costs are spread over a larger base. Always check the current factsheet rather than relying on the TER figure you saw when you first invested.
Where can I check a fund’s current TER?
The most reliable sources are the fund’s monthly factsheet (downloadable from the AMC website), the scheme information document, and the AMC’s website disclosures. According to SEBI regulations, AMCs are required to disclose the current TER for every scheme on their website. AMFI (amfiindia.com) also provides consolidated data.
How much does expense ratio matter for SIP investors with a long horizon?
It matters significantly over long tenures. In a ₹1 lakh monthly SIP at an illustrative 12% gross return, a 1% TER difference produces a corpus gap of over ₹1 crore over 20 years — purely because the cost drag compounds year after year on a growing corpus. For shorter periods of 3–5 years, the gap is much smaller. The longer your SIP tenure, the more weight expense ratio deserves in your evaluation.
Can I switch from a regular plan to a direct plan?
Yes, most AMCs allow you to switch from a regular plan to a direct plan within the same fund. This is typically treated as a redemption and fresh purchase, which may trigger exit load (if within the exit load period) and capital gains tax depending on how long you have held the units. Check the applicable charges and tax impact before switching.
Is expense ratio the same as mutual fund management fees?
Not exactly. The Total Expense Ratio includes the fund management fee (paid to the fund manager), along with other costs such as registrar and transfer agent fees, custodian charges, audit fees, and distribution costs (in regular plans). The fund management fee is a component of the TER, not the TER itself.
Final Verdict
Mutual fund expense ratio impact is easy to underestimate because 0.5% or 1% sounds harmless on a single year’s return. But for a ₹1 lakh monthly SIP held over 15–20 years, that annual cost drag compounds on a growing corpus and can create a wealth gap of ₹40 lakh to over ₹1 crore — without any difference in the underlying fund portfolio. That makes it worth understanding clearly before you invest.
For most investors comparing similar funds in the same category, lower TER is a straightforward advantage. For beginners who need advisory support, the cost of a regular plan may deliver real value — do not switch to direct without knowing what you are giving up. Use expense ratio as one filter among several: returns consistency, risk, fund mandate, and manager track record all matter. Always verify the latest rules from official sources or consult a qualified professional before making any financial decision.
This article is for educational purposes only and should not be treated as personalised financial, tax, investment, insurance, or legal advice. Tax rules, interest rates, regulatory limits, and product features can change with each Budget or policy update. Please verify current rules from official government sources or consult a qualified and registered professional before making any financial decision.

Arjun Kapoor writes about mutual funds, SIPs, ELSS, fund categories, investment returns, and beginner investing concepts for Indian readers. His focus is on education, not product promotion or fund recommendations. He helps readers understand how mutual funds work before they start investing or comparing schemes.
He covers topics such as mutual fund meaning, SIP meaning, SIP calculator, direct mutual funds vs regular plans, NAV, ELSS tax-saving funds, CAGR, absolute returns, XIRR, expense ratio, large cap vs mid cap vs small cap funds, flexi cap funds, index funds vs active funds, liquid funds, debt mutual funds, SIP pause vs SIP stop, lumpsum vs SIP, and how to start SIP in India.
Arjun’s writing is simple, risk-aware, and long-term oriented. He avoids guaranteed-return language and explains investment concepts using examples, timelines, and comparison tables. His articles remind readers that mutual fund investments are subject to market risks, and past performance does not guarantee future returns. Readers should verify scheme details from SEBI, AMFI, fund houses, and official scheme documents.