
You open your mutual fund app and check your SIP portfolio. The screen shows “XIRR: 14.2%.” You switch to the fund’s factsheet and see “3-Year Return: 18.6%.” Then a friend says their lumpsum gave “absolute returns of 65%.” Three different numbers. Same market. Are these even comparable? The answer is no — and understanding why could save you from making very wrong decisions about your money.
Mutual fund returns are not a single number. They change shape depending on what type of investment you made, how long you held it, and how the app or platform calculated it. This article breaks down absolute return, CAGR, and XIRR — what each means, when to use each, and what to never confuse. If you invest through SIPs or are comparing two funds, reading this first will make everything else make sense.
Quick Answer: Mutual Fund Returns
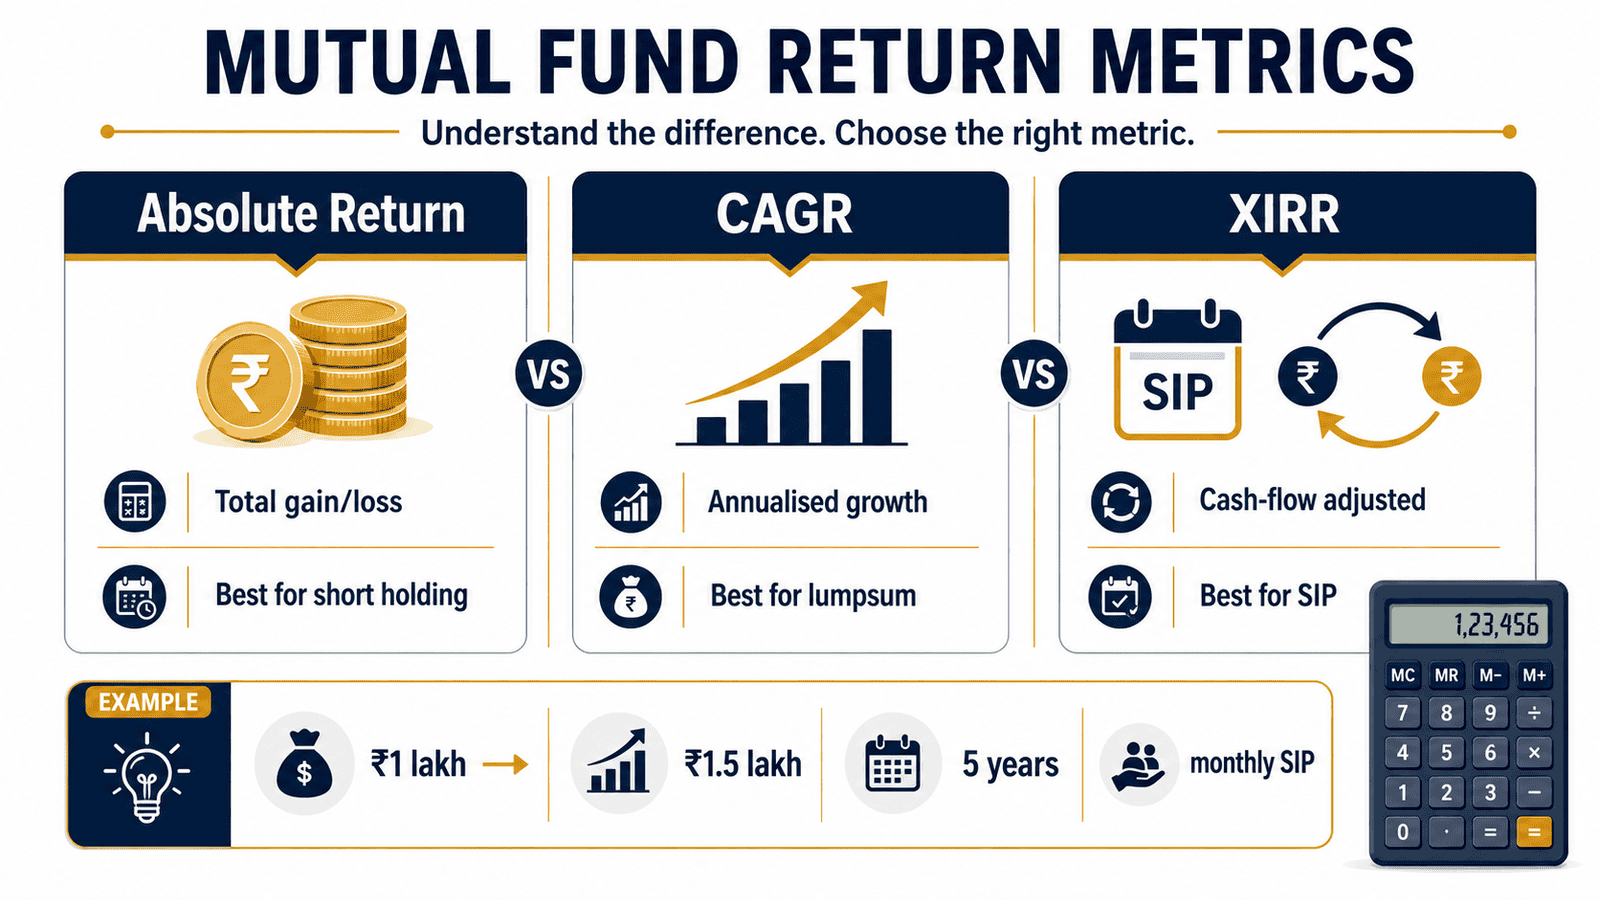
Mutual fund returns can be shown as absolute return, CAGR or XIRR. Absolute return shows total gain, CAGR annualises one lumpsum journey, and XIRR handles SIPs or irregular cash flows. For example, ₹1 lakh becoming ₹1.5 lakh over 5 years needs different interpretation depending on timing.
Key Takeaways
- Absolute return tells you total profit as a percentage — useful only for short holding periods under one year.
- CAGR converts a lumpsum journey into an equivalent annual growth rate — ₹1 lakh growing to ₹2 lakh in 5 years is a CAGR of roughly 14.87%, not 100%.
- XIRR is the only accurate return metric for SIPs — it accounts for every instalment, every date, and the final redemption value.
- Comparing a SIP’s XIRR of 13% with a lumpsum CAGR of 18% is not an apples-to-apples comparison — the metrics are built differently.
- Fund factsheets show trailing returns and point-to-point CAGR — these reflect lumpsum performance, not your SIP experience.
- Your actual SIP XIRR depends heavily on when you started — a fund with 18% trailing CAGR can still give you 11% XIRR if you started at a market peak.
- For investments held under 12 months, absolute return and CAGR diverge significantly — CAGR will annualise a short gain and make it look artificially high.
Comparison: Absolute Return vs CAGR vs XIRR
| Parameter | Absolute Return | CAGR | XIRR |
|---|---|---|---|
| What it measures | Total % gain or loss from start to finish | Annualised growth rate for a single lumpsum investment | Annualised return accounting for multiple cash flows and dates |
| Best used for | Short holding periods, under 1 year | Lumpsum investments held over 1 year | SIPs or any investment with multiple instalments |
| Considers time? | No | Yes | Yes |
| Considers multiple instalments? | No | No | Yes |
| Can be misleading if misapplied? | Yes — for long periods | Yes — for SIPs | Rarely, when used correctly |
| Shown in fund factsheets? | Rarely | Yes — trailing returns | No |
| Shown in SIP portfolio apps? | Rarely | No | Yes — most platforms |
| Formula complexity | Simple | Moderate | Complex — requires spreadsheet or app |
Key Facts at a Glance
| Metric | Formula / Basis | Reliable for |
|---|---|---|
| Absolute Return | (Current Value − Invested Amount) ÷ Invested Amount × 100 | Comparing short-term gains, under 12 months |
| CAGR | (End Value ÷ Start Value) ^ (1 ÷ Years) − 1 | Lumpsum investments over 1 year |
| XIRR | IRR function applied to dated cash flows including redemption | SIPs and investments with multiple entry dates |
| Trailing Return | CAGR from a fixed past date to today — 1Y, 3Y, 5Y | Comparing fund performance over standard periods |
| Rolling Return | Average CAGR across all rolling windows of the same length | Assessing consistency of a fund over time |
Understanding Mutual Fund Returns in Detail
The confusion around mutual fund returns starts with one simple problem: there is no single “return” number. Depending on when you invested, how you invested, and which platform you use, you will see different figures — and each is measuring something different. Understanding how mutual funds work is the foundation before you can interpret what any return number is actually telling you.
Absolute Return: The Simplest (and Most Misleading) Number
Absolute return is exactly what it sounds like — the total percentage change in your investment from the day you put money in to the day you check or redeem. If you invested ₹50,000 and it is now worth ₹65,000, your absolute return is 30%. That is it. No adjustment for time. No compounding.
This is why absolute return can mislead you badly if used for long-term holdings. A 30% absolute return sounds the same whether it happened in 6 months or in 6 years. In reality, those are wildly different outcomes. For short windows under 12 months, absolute return is fine — clean and quick. For anything longer, you need CAGR.
CAGR: The Annual Heartbeat of a Lumpsum Investment
CAGR — Compounded Annual Growth Rate — converts the total journey of a lumpsum investment into an equivalent annual growth rate. It smooths out every up and down and gives you a single number: what annual return would have produced the same result if growth had been perfectly steady every year.
If you put ₹1 lakh into a fund in January 2019 and it became ₹2.1 lakh by January 2024 (five years), your CAGR is approximately 16%. Your absolute return was 110%. These are both accurate — they just say different things. CAGR is the number you use when comparing two lumpsum investments over the same time horizon, or when evaluating a fund’s historical performance.
Fund factsheets published by AMCs show trailing CAGR — the 1-year, 3-year, and 5-year returns calculated from fixed lookback dates. These are lumpsum point-to-point returns. They tell you how a lumpsum investment made exactly 1, 3, or 5 years ago has performed. They say nothing about your SIP experience.
XIRR: The Only Honest Number for SIP Investors
How SIP works is fundamentally different from a lumpsum — every monthly instalment enters the market at a different NAV and a different date. CAGR cannot handle this. It has no way to account for 60 separate ₹10,000 instalments each invested on a different date with different holding periods.
XIRR — Extended Internal Rate of Return — solves this. It treats every instalment as a separate cash flow with its own date, and finds the single annualised discount rate that makes the sum of all those cash flows equal to the final redemption value. In plain terms, it gives each rupee credit for exactly how long it was invested. Instalments made 5 years ago are weighted more than those made last month. This is the return figure most SIP apps show — and it is the most accurate representation of what your systematic investment has actually earned.
XIRR will almost always be lower than the fund’s trailing CAGR, especially in rising markets. That is not a problem with your fund — it is simply because your most recent instalments have had less time to compound. This is also why comparing XIRR across funds is valid, but comparing your XIRR to a fund’s trailing CAGR is not.
Rolling Return and Trailing Return: For Fund Comparison Only
When you want to compare two funds rather than understand your personal return, trailing return is the standard tool. Platforms like Value Research and Morningstar India report 1Y, 3Y, and 5Y trailing CAGR consistently across all funds — making fund-to-fund comparisons fair.
Rolling return goes further: it calculates the CAGR for every possible rolling window of the same length (say, every 3-year window from January 2015 to today) and averages them. A fund with a high average rolling return and low variance is a more consistent performer than one with a high trailing CAGR but volatile history. These are metrics for fund selection — not for reading your own portfolio returns.
Real Example: Amit’s SIP in Pune
Amit, 31, a software engineer in Pune earning ₹1.2 lakh per month, started a ₹10,000 monthly SIP in a large-cap equity fund in April 2021. By April 2024 — exactly 3 years — he had invested ₹3,60,000 across 36 instalments. His portfolio value is ₹4,62,000.
His absolute return: (₹4,62,000 − ₹3,60,000) ÷ ₹3,60,000 × 100 = 28.3%.
The fund’s 3-year trailing CAGR shown on the factsheet: 17.4%.
Amit’s XIRR (calculated by his app): 16.8%.
Notice what’s happening. The fund’s trailing CAGR is the return on a lumpsum made in April 2021. Amit’s XIRR is slightly lower because his more recent instalments — those from 2023 and 2024 — have had less time to compound. His absolute return of 28.3% sounds lower than the CAGR, because absolute return does not annualise — it just shows the raw total. None of these numbers is wrong. Each is measuring a different thing. The key insight: for Amit, XIRR (16.8%) is the only number that accurately reflects what his actual SIP investment has earned.
How to Calculate Each Return Metric
Absolute Return = (Current Value − Invested Amount) ÷ Invested Amount × 100
Using Amit’s example: (₹4,62,000 − ₹3,60,000) ÷ ₹3,60,000 × 100 = 28.3%
CAGR = (End Value ÷ Start Value) ^ (1 ÷ Number of Years) − 1
For a lumpsum of ₹1,00,000 growing to ₹2,00,000 in 5 years: (2,00,000 ÷ 1,00,000) ^ (1 ÷ 5) − 1 = 14.87% CAGR
XIRR = IRR applied to all dated cash flows + final redemption value
XIRR requires each SIP instalment listed with its date as a negative cash flow, and the final portfolio value listed as a positive cash flow. You can calculate this in Excel using the =XIRR() function, or use your mutual fund app’s built-in return calculator. After learning your XIRR and SIP return logic, you can also estimate future SIP growth using a dedicated calculator.
| Scenario | Key Inputs | Result |
|---|---|---|
| Lumpsum ₹1L → ₹2L in 5 years | Start: ₹1,00,000 | End: ₹2,00,000 | Period: 5 years | CAGR: 14.87% |
| ₹10,000/month SIP for 3 years, value ₹4,62,000 | 36 monthly flows | Total invested: ₹3,60,000 | End value: ₹4,62,000 | XIRR: ~16.8% |
| ₹50,000 lumpsum → ₹65,000 in 8 months | Gain: ₹15,000 | Period: under 1 year | Absolute Return: 30% (CAGR would overstate at ~49%) |
How to Decide What’s Right for You
You made a single lumpsum investment and have held it for more than one year — THEN use CAGR to evaluate your return. It accounts for compounding and time, giving you the true annual growth rate.
You invest monthly through a SIP — THEN use XIRR. Any other metric will either overstate or understate your actual return by ignoring the dates and amounts of each instalment. Read about lumpsum vs SIP to understand how your investment style shapes which return metric applies.
You held a short-term liquid fund or debt fund for under 12 months — THEN absolute return is acceptable, though CAGR on a short window will look inflated and mislead you.
You want to compare two mutual funds against each other — THEN use trailing CAGR (1Y, 3Y, 5Y) from a consistent source like Value Research or Morningstar India. Do not compare your personal XIRR to a fund’s trailing CAGR — they are not the same thing.
You want to judge how consistent a fund has been over long periods — THEN look at rolling returns, not just trailing CAGR. A fund with high but volatile trailing CAGR can be riskier than one with slightly lower but steady rolling returns.
You made multiple lumpsum investments in the same fund at different times, plus redemptions — THEN XIRR is also the right metric, not CAGR. CAGR only works for a single entry and exit point.
If you are not sure whether a return percentage is CAGR, absolute, or XIRR — do not compare it to another fund’s percentage without first confirming what metric each is using. Mixing metrics is one of the most common and costly mistakes in fund evaluation.
Common Mistakes to Avoid
Comparing XIRR to Trailing CAGR as if they are equal
Your SIP app shows XIRR 13% and the fund factsheet shows 5-year trailing CAGR 18%. These are not comparable directly.
Trailing CAGR is for a single lumpsum made 5 years ago. Your XIRR is for 60 monthly instalments made over 5 years, each with a different holding period. The recent instalments drag XIRR lower because they have had less time to grow — that is correct behaviour, not a fund problem.
Always compare your XIRR to the XIRR of another SIP in another fund, not to trailing CAGR.
Using absolute return to evaluate a 3-year or 5-year investment
A ₹1 lakh investment worth ₹1.9 lakh after 5 years has an absolute return of 90%. Sounds impressive. But the CAGR is just 13.7% — roughly in line with a broad equity index. Absolute return inflates perception for longer holding periods.
Mentally train yourself to demand CAGR whenever the holding period exceeds 12 months.
Applying CAGR to a SIP portfolio
Some investors calculate CAGR by using total invested amount as the starting value and current portfolio value as the ending value. This gives a meaningless number because it treats all ₹3.6 lakh as if it was invested on day one — which it was not.
The early instalments compounded for 3 years. The latest instalment compounded for 1 month. CAGR cannot distinguish between them. Use XIRR.
Ignoring the investment date when reading fund factsheets
Fund factsheet trailing returns are calculated from a specific date — say 3 years ago today. If markets were depressed 3 years ago, the trailing CAGR will look exceptionally high. If markets peaked 3 years ago, it will look low. Trailing CAGR is not a universal promise — it is a snapshot from a particular starting point.
Check the fund’s rolling return to get a more consistent picture of how it performs across different starting points.
Not accounting for the plan type when comparing returns
A direct plan and a regular plan of the same fund will show different CAGR over 5+ years — often 0.5% to 1.5% per year apart due to the expense ratio. If you are comparing your regular plan’s XIRR to a direct plan’s trailing CAGR, you are not comparing the same product. Direct and regular plans differ meaningfully in net returns — always compare like with like.
Assuming a higher return percentage always means a better outcome
A fund showing 22% CAGR over 1 year and one showing 14% CAGR over 5 years are not obviously comparable. The 1-year number is highly sensitive to market timing. The 5-year CAGR is far more meaningful for long-term investors. Short holding periods can produce eye-catching percentages that do not reflect the fund’s true character.
Confusing NAV growth with your personal return
If a fund’s NAV has grown from ₹100 to ₹200 in 5 years, that is a 14.87% CAGR for the NAV itself. But NAV meaning explained — your personal return depends entirely on when you bought and at what NAV. Buying at ₹160 and the NAV reaching ₹200 in 1 year is a 25% absolute return in one year, nothing like the 5-year track record.
Ignoring tax when comparing post-redemption returns
CAGR and XIRR are pre-tax figures. If your equity fund has a CAGR of 15% but your gains attract 12.5% Long-Term Capital Gains tax (on gains above ₹1.25 lakh), your effective net return is lower. Comparing a post-tax fixed deposit return to a pre-tax mutual fund CAGR is not a fair comparison. Always align the tax treatment before concluding one instrument beats another.
When This May Not Be the Right Choice
Understanding these return metrics is essential for anyone in equity or hybrid mutual funds. However, using XIRR or CAGR as your primary decision tool may not be the best approach in certain situations.
If your investment horizon is under 3 years, CAGR and XIRR can still be calculated but short-term equity returns are volatile and unreliable as predictors of future performance — basing decisions heavily on them adds risk.
If you are investing in debt mutual funds primarily for capital preservation, obsessing over CAGR differences of 0.5–1% between funds may lead you to overlook credit quality and duration risk, which matter more in debt investing.
If you are new to investing and find XIRR confusing, it is more useful to first focus on the amount you are investing consistently and your asset allocation before optimising return metrics. A stable ₹10,000 monthly SIP in a well-diversified fund matters more than whether your XIRR is 13% or 14.5% in year one.
If any of these apply to your situation, it may be worth exploring alternatives before committing.
Official Rules and Where to Verify
Mutual fund performance disclosures in India are governed by SEBI guidelines. All AMCs are required to disclose standardised trailing CAGR figures in their fund factsheets and advertisements. SEBI has prescribed how past performance must be shown to prevent misleading comparisons.
Rules, limits, and rates on this topic can change with each Budget or regulatory update. Always verify current figures directly from the official source before making any financial decision.
- SEBI (Securities and Exchange Board of India) — sebi.gov.in — governs mutual fund disclosure norms, performance reporting standards, and investor protection guidelines.
- NAV meaning explained — understand that returns come from NAV movement, not fixed interest, which is the foundation of all return calculations.
Expert Tips
- Always check whether a return percentage shown to you is CAGR, absolute, or XIRR before acting on it. Three platforms can show three different numbers for the same fund and the same holding period — all technically correct, all measuring different things.
- If you want to compare your SIP performance to a benchmark index, calculate the XIRR of a hypothetical SIP in the Nifty 50 TRI (Total Return Index) over the same period. A fund is genuinely outperforming only if its XIRR exceeds the index XIRR for the same cash flows.
- Use Excel’s =XIRR() function at least once on your own SIP data. Enter each monthly instalment as a negative value with its date, and your current portfolio value as a positive value with today’s date. This gives you the most accurate personal return and removes any platform rounding.
- A fund’s 5-year trailing CAGR matters far more than its 1-year CAGR when you are selecting a fund for a long-term goal. 1-year numbers can be distorted by a single market rally or crash.
- If your SIP XIRR looks low after only 1–2 years, do not panic. XIRR is lower in early years because most instalments are recent and have had minimal compounding time. The same SIP typically shows a rising XIRR as years pass and earlier instalments compound more.
- Do not compare direct plan XIRR with regular plan CAGR. The expense ratio difference compounds into a meaningful gap over 5–10 years. Standardise the comparison to the same plan type.
- Before switching funds based on return comparisons, check whether the outperformance is consistent using rolling returns — not just a lucky trailing CAGR window. One year’s strong trailing CAGR is often noise, not signal.
Frequently Asked Questions
What is the difference between CAGR and absolute return in mutual funds?
Absolute return shows the total percentage gain or loss from investment to current value, ignoring how long it took. CAGR converts that total journey into an equivalent annual rate. A ₹1 lakh investment growing to ₹1.5 lakh in 3 years has an absolute return of 50%, but a CAGR of around 14.47%. CAGR is more useful because it allows fair comparison between investments held for different periods.
Why does my SIP app show XIRR and not CAGR?
CAGR only works for a single lumpsum — one entry point, one exit point. Your SIP has 12, 24, or 60+ entry points. XIRR is the mathematically correct metric for multiple cash flows because it accounts for the exact date and amount of every instalment. Showing CAGR for a SIP portfolio would give a misleading number.
Is a higher XIRR always better?
Generally yes, but only when comparing SIPs in similar fund categories over similar periods. A small-cap fund SIP might show 19% XIRR and a large-cap fund SIP might show 13% XIRR — but the small-cap carried much higher risk and volatility. Compare XIRR within the same fund category and over the same time window for a fair assessment.
Can I use XIRR for a lumpsum investment?
Yes, you can. XIRR works for lumpsum investments too — you would have just two cash flows: the initial investment (negative) and the redemption value (positive), each with a date. The result will match CAGR for a simple lumpsum held from start to finish. XIRR is simply the more flexible version.
What is a good XIRR for a SIP in equity mutual funds in India?
Mutual fund investments are subject to market risks and past performance does not guarantee future returns. That said, equity mutual fund SIPs over a 5-year or longer horizon have historically shown XIRR in the range of 10% to 16% for diversified large-cap and flexi-cap funds — but this varies significantly with the starting date, fund quality, and market conditions during the period.
Why is my fund’s XIRR lower than its trailing CAGR?
This is normal and expected. Trailing CAGR shows what a lumpsum made on a specific past date has earned — all of that money had the full period to compound. Your SIP’s XIRR is lower because recent instalments have had very little time to compound. This gap narrows as your SIP matures and older instalments represent a larger portion of the portfolio.
What happens if I switch funds mid-SIP — which return metric applies?
If you switch from Fund A to Fund B mid-way, your XIRR should be calculated across the full chain — treating the redemption from Fund A as a cash inflow and the new instalments in Fund B as outflows. Most apps do not do this automatically for switched portfolios. For switched investments, calculate XIRR manually in Excel to get your true blended return.
Is absolute return ever the right metric to use?
Yes — for very short holding periods under 12 months, absolute return is clean and sensible. For a liquid fund held for 45 days, absolute return tells you exactly what you earned. CAGR for periods under a year will annualise a short return and make it look much higher than it actually is — for example, a 3% absolute return in 2 months becomes roughly 19% annualised CAGR, which is technically accurate but practically misleading.
Do fund factsheets show XIRR?
No. SEBI requires fund factsheets to disclose trailing CAGR returns (1Y, 3Y, 5Y, since inception). XIRR is a personal return metric — it depends on each investor’s specific investment dates and amounts. Factsheets cannot show XIRR because it differs for every investor. Your mutual fund app or platform calculates XIRR for your specific portfolio.
How do I calculate XIRR for my SIP in Excel?
List all your SIP instalments in column A (as negative numbers, since they are cash outflows) and their corresponding dates in column B. On the last row, enter today’s portfolio value as a positive number with today’s date. Then use the formula =XIRR(A1:An, B1:Bn) where n is the last row. Excel returns the annualised XIRR as a decimal — multiply by 100 for the percentage.
Final Verdict
Mutual fund returns are not a single number — they are three different tools for three different situations. Absolute return works for holdings under a year. CAGR gives you the clean annualised story of a lumpsum investment. XIRR is the only honest return metric for SIP investors. Using the wrong one leads to false comparisons, wrong fund choices, and misplaced satisfaction or alarm about your portfolio.
For most salaried investors in India who invest through SIPs, XIRR is the number that matters most. The fund’s trailing CAGR is useful when selecting a fund — but once you are invested, your XIRR tells you what your money has actually earned. Mutual fund investments are subject to market risks. Past performance does not guarantee future returns. Reference SEBI’s investor guidelines at sebi.gov.in for disclosure norms and your rights as an investor.
If you are building a long-term SIP portfolio, understanding these metrics is one step — knowing how much to invest consistently is another. Explore the lumpsum vs SIP comparison to find the approach that fits your financial situation. Always verify the latest rules from official sources or consult a qualified professional before making any financial decision.
This article is for educational purposes only and should not be treated as personalised financial, tax, investment, insurance, or legal advice. Tax rules, interest rates, regulatory limits, and product features can change with each Budget or policy update. Please verify current rules from official government sources or consult a qualified and registered professional before making any financial decision.

Arjun Kapoor writes about mutual funds, SIPs, ELSS, fund categories, investment returns, and beginner investing concepts for Indian readers. His focus is on education, not product promotion or fund recommendations. He helps readers understand how mutual funds work before they start investing or comparing schemes.
He covers topics such as mutual fund meaning, SIP meaning, SIP calculator, direct mutual funds vs regular plans, NAV, ELSS tax-saving funds, CAGR, absolute returns, XIRR, expense ratio, large cap vs mid cap vs small cap funds, flexi cap funds, index funds vs active funds, liquid funds, debt mutual funds, SIP pause vs SIP stop, lumpsum vs SIP, and how to start SIP in India.
Arjun’s writing is simple, risk-aware, and long-term oriented. He avoids guaranteed-return language and explains investment concepts using examples, timelines, and comparison tables. His articles remind readers that mutual fund investments are subject to market risks, and past performance does not guarantee future returns. Readers should verify scheme details from SEBI, AMFI, fund houses, and official scheme documents.