

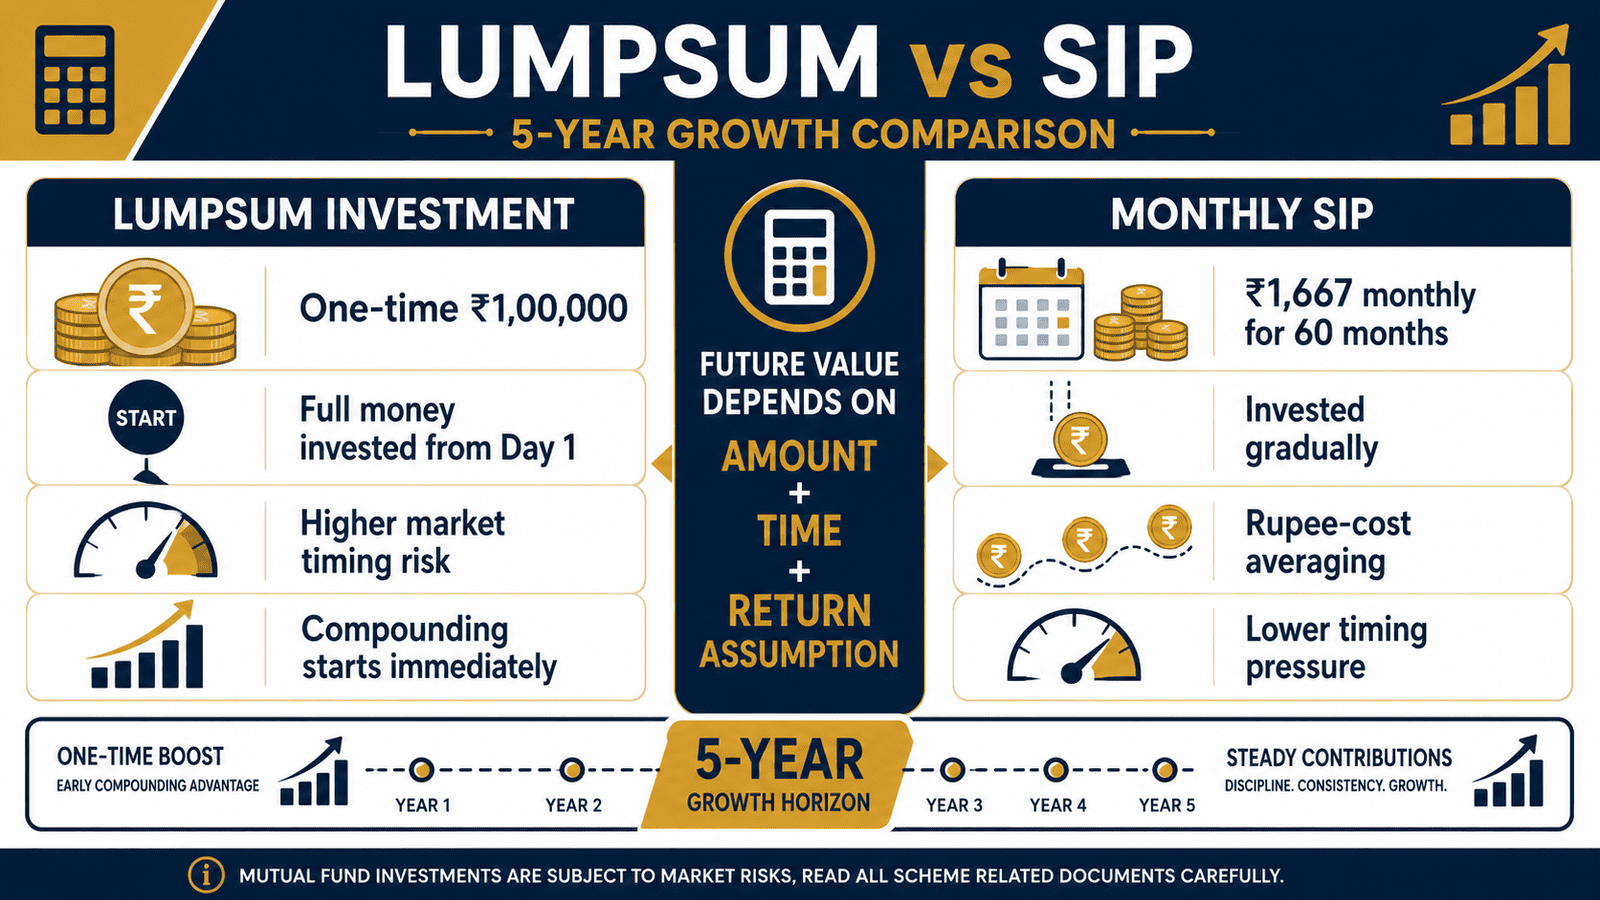
You have ₹1,00,000 sitting in your savings account. The question every investor eventually asks: invest it all today, or spread it across 60 monthly SIPs of ₹1,667 each? Both routes put roughly the same money into a mutual fund over 5 years — but the outcomes can be very different. A lumpsum vs SIP calculator helps you see why that difference exists and what drives it. The answer is not about which method is “better.” It is about how compounding, market timing, and your own cash flow interact over a 5-year horizon. This article walks through the calculator logic, a real comparison, and the decision framework you need — before you invest a single rupee.
Quick Answer: Lumpsum vs SIP Calculator
A lumpsum vs SIP calculator shows whether one-time investing or monthly SIP grows more over 5 years based on amount, return and timing. For example, ₹1,00,000 lumpsum and ₹1,667 monthly SIP over 60 months can end differently because market entry timing and compounding period are not the same.
How to Calculate Lumpsum vs SIP Growth Over 5 Years
Both methods involve roughly ₹1,00,000 total, but the maths works differently for each.
Lumpsum Future Value = P × (1 + r)^n
Where P = Principal invested, r = Annual return rate, n = Number of years
SIP Future Value = M × [((1 + i)^n − 1) / i] × (1 + i)
Where M = Monthly instalment, i = Monthly return rate (annual rate ÷ 12), n = Number of months
Here is how the same ₹1,00,000 grows under three assumed annual return scenarios — these are illustrative scenarios only, not forecasts:
| Assumed Annual Return | ₹1,00,000 Lumpsum (5 Years) | ₹1,667/Month SIP (60 Months) |
|---|---|---|
| 8% | ≈ ₹1,46,933 | ≈ ₹1,22,800 |
| 10% | ≈ ₹1,61,051 | ≈ ₹1,29,700 |
| 12% | ≈ ₹1,76,234 | ≈ ₹1,36,900 |
The lumpsum shows a larger final value in every rising-market scenario above — because the full ₹1,00,000 compounds from day one. The SIP invests only ₹1,667 in month one; the bulk of your money enters the market in months 30–60, with far less compounding time remaining.
However, the SIP scenario above assumes the same flat return every month. Real markets are volatile. If you invest ₹1,00,000 as a lumpsum the day before a sharp correction — say markets fall 30% in year one — your starting base shrinks immediately. The SIP investor, contributing monthly, buys more units when prices fall, which is the core of rupee-cost averaging.
The practical rule from the calculator: lumpsum wins in steadily rising markets; SIP provides a smoother ride when markets are choppy. Run your own scenarios using the SIP calculator guide to test different return assumptions against your actual monthly figure.
Key Takeaways
- With the same ₹1,00,000 total invested at an assumed 12% return, lumpsum can produce approximately ₹39,000 more than an equivalent SIP over 5 years — because the full amount compounds from month one.
- SIP spreads your entries across 60 months, so your average purchase cost is not your first-day price — this is rupee-cost averaging, and it reduces the impact of a single bad entry point.
- Calculator results change significantly with return assumptions: at 8% vs 12%, the lumpsum difference alone spans ₹29,000 — reinforce why the rate you assume matters.
- Equal total investment does not mean equal final value — timing, compounding period, and sequence of returns all affect the outcome.
- Emotional comfort matters: an investor who stops their SIP during a 20% market fall loses the averaging benefit entirely — discipline is part of the return equation.
- Mutual fund returns are market-linked; past performance does not guarantee future returns — calculator outputs are scenario tools, not return promises.
Key Facts at a Glance
| Parameter | Lumpsum | SIP |
|---|---|---|
| Investment style | One-time, full amount upfront | Fixed amount every month |
| Cash flow requirement | Full amount available today | Monthly surplus required |
| Market timing risk | High — entry point matters significantly | Spread — 60 entry points over 5 years |
| Compounding period | Full 5 years from day one | Longest for earliest instalments; shortest for last |
| Behavioural comfort | Lower if markets fall after entry | Higher — automatic, regular, disciplined |
| Suitable investor | Has idle capital; long horizon; higher risk tolerance | Salaried; monthly surplus; prefers gradual exposure |
How Lumpsum and SIP Investing Actually Work
Before comparing outcomes, it helps to understand what each method actually does to your money once it enters a mutual fund.
Lumpsum Investing
When you invest ₹1,00,000 as a lumpsum, the fund house allocates mutual fund units to you at that day’s NAV. If the NAV is ₹50, you receive 2,000 units on day one. From that moment, your entire ₹1,00,000 is working in the market — rising and falling with the fund’s portfolio every single day for the next 5 years.
This is why lumpsum benefits most in markets that trend upward without significant corrections. The longer compounding runs on your full amount, the more it compounds. Understanding the power of compounding makes this difference intuitive: ₹1 invested today at 12% doubles in roughly 6 years. Every month you delay, you lose that compounding window.
SIP Investing
A Systematic Investment Plan deducts a fixed amount — say ₹1,667 — from your bank account on a fixed date every month and buys mutual fund units at that month’s NAV. In month one, ₹1,667 buys 33.3 units at NAV ₹50. In month six, if the NAV has dropped to ₹45, the same ₹1,667 buys 37 units. This automatic buying of more units when prices fall is rupee-cost averaging — and it is the core structural benefit of how SIP works.
How Volatility Affects Each Method
Volatility helps the SIP investor — each market dip is an opportunity to accumulate more units at lower prices. The same volatility can hurt the lumpsum investor if the correction arrives shortly after investment. A 25% market fall in year one on a ₹1,00,000 lumpsum means your portfolio is worth ₹75,000 immediately. Recovery takes time, and that lost compounding time is hard to reclaim fully.
This is not a reason to avoid lumpsum investing. It is a reason to match your method to your risk tolerance and timeline honestly.
Real Example: Aarav’s ₹1,00,000 Decision
Aarav, 31, is a software engineer in Pune earning ₹18 lakh per year. He has ₹1,00,000 saved after maintaining his emergency fund and wants to invest it in an equity mutual fund for 5 years.
Option A — Lumpsum: Aarav invests ₹1,00,000 today. At an assumed 12% annual return, his investment grows to approximately ₹1,76,234 in 5 years. If the market rises steadily, he benefits from full compounding on the entire corpus from month one.
Option B — SIP: Aarav invests ₹1,667 every month for 60 months, totalling ₹1,00,020. At the same assumed 12% return, this grows to approximately ₹1,36,900. The difference is not a flaw in SIP — it reflects that each SIP instalment has a shorter compounding window. The last ₹1,667 invested in month 60 compounds for zero additional months.
What if markets fall first? If markets drop 20% in year one and recover strongly in years 2–5, the SIP investor buys units cheaply during the fall. Aarav’s SIP total could end higher in that specific sequence. The lumpsum investor starts in a deeper hole and needs a stronger recovery to match.
Key insight: the winner depends not just on return rate but on the sequence of returns — and no calculator can predict that sequence in advance.
Comparison: Lumpsum vs SIP Across Key Dimensions
| Parameter | Lumpsum | SIP |
|---|---|---|
| Growth in steadily rising market | Higher | Moderate |
| Growth in volatile/falling market | Lower risk-adjusted | Better via averaging |
| Upfront cash needed | Full ₹1,00,000 today | ₹1,667/month only |
| Builds monthly discipline | No | Yes |
| Suitable for salaried income | If bonus/windfall | Primary method |
| Return measure to use | CAGR / Absolute return | XIRR (accounts for timing of each SIP) |
When you see returns quoted for SIP investments, the correct measure is XIRR — it accounts for the fact that each monthly instalment was invested at a different point in time. CAGR is appropriate for lumpsum investments. For a full explanation of these return terms, see mutual fund return types.
How to Decide What’s Right for You
You have a lump sum available — a bonus, maturity amount, or savings — and your investment horizon is at least 5 years with a healthy emergency fund in place — THEN lumpsum investing in an equity mutual fund may be appropriate to consider.
Your income is monthly and you don’t have a large idle sum — THEN a regular monthly SIP is the more practical and sustainable route for building wealth over time.
You have ₹1,00,000 available but are anxious about market timing — THEN consider splitting: invest ₹50,000 as lumpsum today and deploy the remaining ₹50,000 as a 6-month STP (Systematic Transfer Plan) into the equity fund.
Markets have recently fallen sharply and valuations look more reasonable — THEN lumpsum may have a better risk-reward at that entry point than in an already-elevated market.
Your 5-year goal is a fixed target — a home purchase or child’s education fee — THEN a pure equity SIP or lumpsum carries meaningful risk of shortfall; hybrid or debt-oriented funds may be worth exploring for goal-critical money.
You do not have an emergency fund of at least 3–6 months of expenses — THEN neither lumpsum nor SIP in equity is appropriate until that buffer is in place. Investing without an emergency fund means you may be forced to redeem during a market fall.
For a broader framework beyond calculator outputs, read the full guide on lumpsum and SIP choice.
Common Mistakes to Avoid
Comparing Unequal Investment Amounts
Many online comparisons show ₹1,00,000 lumpsum vs ₹5,000/month SIP — which is ₹3,00,000 over 5 years, three times more invested.
This makes SIP look dramatically better, not because SIP is superior, but because three times more money was put in. The comparison becomes meaningless for actual decision-making.
Always compare equal total investment amounts: ₹1,00,000 lumpsum against ₹1,667/month SIP for a fair calculator test.
Assuming SIP Guarantees Better Returns
SIP is often marketed as the “safer” or “smarter” option. In a steadily rising market, a lumpsum invested at the start will almost always outperform an equivalent SIP — because more money compounds for longer.
SIP’s advantage is in volatile or falling markets, not in all markets. Treating it as a return guarantee is a misunderstanding that can lead to poor portfolio decisions.
Use the calculator to test both flat-return and scenario-based outcomes before deciding.
Using Unrealistic Return Assumptions
Plugging 18% or 20% annual returns into a calculator because a fund delivered that over the past 1–2 years is one of the most common beginner errors.
A 5-year equity mutual fund CAGR in India has historically ranged widely — from negative in bad cycles to 15%+ in strong cycles. Using 20% to project a ₹1,00,000 lumpsum gives ₹2,48,832 — which sets an expectation that may not materialise.
Use 10–12% as a conservative base scenario for equity funds, and always run a 6–8% scenario to stress-test your plan.
Ignoring Sequence of Returns
A flat 12% return is not how markets actually behave. Markets can fall 30% in year one and rise 25% in year two. The sequence in which those returns arrive changes your actual corpus even if the average is identical.
Lumpsum investors are more exposed to poor early-year returns. Understanding this is not a reason to avoid lumpsum — it is a reason to be honest about timing risk.
Stopping SIP During Market Falls
The entire value of rupee-cost averaging disappears if you pause or stop your SIP when markets fall 15–20%. That is precisely when each ₹1,667 buys the most units.
Investors who stopped SIPs during the 2020 market crash missed some of the cheapest unit prices in a decade. The recovery that followed rewarded those who stayed invested.
Set up auto-debit and treat the SIP like a utility bill — non-negotiable.
Ignoring Expense Ratio and Plan Type
A 0.5% difference in annual expense ratio between two funds compounding on ₹1,00,000 over 5 years at 12% reduces final value by approximately ₹4,500. Over 10 years, that gap nearly doubles.
Direct plans have lower expense ratios than regular plans. This affects both lumpsum and SIP outcomes. Factor it into your calculator before comparing funds.
When This May Not Be the Right Choice
A 5-year equity mutual fund investment — whether lumpsum or SIP — is not the right tool for every financial situation:
- Short actual need window: If you need the money in 2–3 years, equity funds carry meaningful risk of a market downturn wiping out gains. A 5-year label does not protect you if your real deadline is shorter.
- No emergency fund: Investing ₹1,00,000 while having no liquid buffer means a job loss or medical expense forces you to redeem at whatever price the market offers — which may be a loss.
- Very low risk tolerance: If a 20% portfolio drawdown would cause you to redeem everything in panic, equity mutual funds — lumpsum or SIP — will not serve you well regardless of the calculator projections.
- Goal-critical money: Money earmarked for a fixed-date goal like a wedding or home down payment in exactly 5 years should not carry equity volatility risk without a clear plan to de-risk closer to the date.
If any of these apply to your situation, it may be worth exploring alternatives before committing.
Official Rules and Where to Verify
Mutual fund investments in India are regulated by the Securities and Exchange Board of India. SEBI sets the rules for fund registration, disclosure, expense ratio caps, and investor protection. All mutual fund schemes are required to display a risk-o-meter and publish their Scheme Information Document (SID) and Key Information Memorandum (KIM) for investor reference.
Rules, limits, and rates on this topic can change with each Budget or regulatory update. Always verify current figures directly from the official source before making any financial decision.
- SEBI (Securities and Exchange Board of India) — sebi.gov.in
- AMFI (Association of Mutual Funds in India) — amfiindia.com
- Individual fund house websites for SID, KIM, and NAV data
Expert Tips
- Run three return scenarios, not one. Before investing, test your ₹1,00,000 at 8%, 10%, and 12% annual returns. The difference between the best and worst case spans over ₹29,000 for lumpsum alone — your decision should account for the full range, not just the optimistic number.
- Always compare equal total investment. If you are testing SIP vs lumpsum in any calculator, ensure the total invested is identical — ₹1,00,000 lumpsum against ₹1,667 × 60 months. Unequal amounts produce meaningless comparisons.
- Check direct vs regular plan before investing. The same equity fund in a direct plan can save you 0.5–1% in annual expense ratio compared to a regular plan. Over ₹1,00,000 at 12% for 5 years, that compounds to a meaningful difference. Read the full breakdown of direct and regular plans before you place your investment.
- Do not use the last 1-year return as your calculator input. If a fund delivered 28% in the past year, that is a rear-view figure driven by a specific market cycle. Use 10–12% for a conservative 5-year equity scenario estimate.
- Check the fund’s risk-o-meter before you invest a lumpsum. A small-cap or thematic fund can fall 40–50% in a bear market. A lumpsum into such a fund carries significantly higher sequence-of-returns risk than a lumpsum into a large-cap or index fund. Match fund category to your actual risk tolerance.
- If you are genuinely unsure about timing, use an STP. A Systematic Transfer Plan parks your lumpsum in a liquid or overnight fund and moves a fixed amount into the equity fund each month — giving you rupee-cost averaging without leaving money idle in a savings account earning 3–4%.
- Review your SIP amount annually. A step-up SIP — increasing your monthly amount by 10% each year — can significantly boost final corpus without requiring a lumpsum commitment. Run that scenario in a step-up SIP calculator to see the difference.
Frequently Asked Questions
Is SIP better than lumpsum for a 5-year investment?
Not automatically. In a steadily rising market, lumpsum tends to grow more because the full amount compounds from day one. SIP’s advantage is in volatile markets, where rupee-cost averaging reduces the impact of a bad entry point. The better choice depends on market conditions, your cash availability, and your risk tolerance — not a universal rule.
Does lumpsum always give higher returns than SIP?
No. If markets fall significantly after your lumpsum entry, your corpus shrinks immediately and recovery takes time. An SIP investor who keeps investing during that fall accumulates more units at lower NAVs, which can produce a better outcome in that specific return sequence. Lumpsum outperforms in rising markets; SIP can outperform in volatile or falling ones.
Can I split a lumpsum into a monthly SIP-like plan?
Yes — this is called a Systematic Transfer Plan (STP). You invest the lumpsum in a liquid or overnight fund first, then transfer a fixed amount into an equity fund each month. It combines the benefit of not leaving money idle with rupee-cost averaging. Most major fund houses offer STP as a standard facility.
What return rate should I use in a lumpsum vs SIP calculator?
Use 10–12% as a base scenario for diversified equity mutual funds over 5 years — and always run a conservative 6–8% scenario alongside it. Do not use a fund’s last 1-year return as your input; recent performance can be significantly above or below long-term averages and is not a reliable projection tool.
Is 5 years long enough for an equity mutual fund investment?
Five years is generally considered a minimum reasonable horizon for equity mutual funds, but it is not a guarantee of positive returns. Indian equity markets have had 5-year periods with flat or negative returns in specific cycles. If your goal is fixed and non-negotiable at exactly 5 years, consider a hybrid fund or a glide-path approach rather than pure equity exposure throughout.
What is rupee-cost averaging and does it always help?
Rupee-cost averaging means buying more fund units when prices are low and fewer when prices are high, because your monthly SIP amount stays fixed. It reduces the risk of investing everything at a market peak. However, if markets only rise throughout your SIP period, you would have been better off investing the full lumpsum at the start — so averaging is a risk-reduction tool, not a return booster in all scenarios.
What is XIRR and why does it matter for SIP returns?
XIRR is the extended internal rate of return — it calculates the actual annualised return from a series of investments made at different points in time. For SIP investments, where each ₹1,667 was invested on a different date at a different NAV, XIRR is the only accurate way to measure your real return. A simple CAGR on total invested vs final value will overstate or understate your actual SIP return.
Can I do both lumpsum and SIP at the same time?
Yes, and many investors do. You can invest ₹50,000 as a lumpsum today and run a ₹2,000/month SIP alongside it. This approach captures some lumpsum compounding advantage while maintaining monthly discipline and rupee-cost averaging. There is no rule that you must choose only one method.
Does the comparison change for a 10-year horizon instead of 5 years?
Yes, significantly. Over 10 years, the lumpsum advantage tends to grow larger in rising markets because the compounding effect on the full amount runs for twice as long. SIP’s averaging benefit also strengthens over longer periods because you capture more market cycles. For a 10-year horizon, the gap between the two methods generally widens — making the initial market entry point less critical over time.
Final Verdict
The lumpsum vs SIP calculator does not produce a single winner — it produces context. In a steadily rising market, lumpsum investing on ₹1,00,000 at an assumed 12% return can produce approximately ₹39,000 more than an equivalent SIP over 5 years. In a volatile or falling market, the same SIP can outperform because rupee-cost averaging lowers your average purchase cost. The calculator is a scenario-testing tool — not a prediction. Use it to understand how your expected return assumption, entry timing, and compounding period interact before you commit. If you are salaried with no large idle sum, SIP is the practical and disciplined default. If you have a lump sum available and a 5-year horizon with a full emergency fund, lumpsum or STP is worth serious consideration. Always verify the latest rules from official sources or consult a qualified professional before making any financial decision.
This article is for educational purposes only and should not be treated as personalised financial, tax, investment, insurance, or legal advice. Tax rules, interest rates, regulatory limits, and product features can change with each Budget or policy update. Please verify current rules from official government sources or consult a qualified and registered professional before making any financial decision.

Arjun Kapoor writes about mutual funds, SIPs, ELSS, fund categories, investment returns, and beginner investing concepts for Indian readers. His focus is on education, not product promotion or fund recommendations. He helps readers understand how mutual funds work before they start investing or comparing schemes.
He covers topics such as mutual fund meaning, SIP meaning, SIP calculator, direct mutual funds vs regular plans, NAV, ELSS tax-saving funds, CAGR, absolute returns, XIRR, expense ratio, large cap vs mid cap vs small cap funds, flexi cap funds, index funds vs active funds, liquid funds, debt mutual funds, SIP pause vs SIP stop, lumpsum vs SIP, and how to start SIP in India.
Arjun’s writing is simple, risk-aware, and long-term oriented. He avoids guaranteed-return language and explains investment concepts using examples, timelines, and comparison tables. His articles remind readers that mutual fund investments are subject to market risks, and past performance does not guarantee future returns. Readers should verify scheme details from SEBI, AMFI, fund houses, and official scheme documents.