

You open a stock app, tap on a company, and see its share price — ₹540. Is that expensive? Is it cheap? The number alone tells you nothing. Two companies can both trade at ₹540 and one can be dramatically overpriced while the other looks like a bargain. That is exactly why the P/E ratio meaning matters before you touch a stock. Understanding the basics of stock market basics will show you that valuation ratios like P/E are among the first tools serious investors learn. This article walks you through the formula, a clear Indian example, what high and low P/E actually mean, trailing versus forward P/E, and — critically — where P/E completely breaks down.
Quick Answer: P/E Ratio Meaning
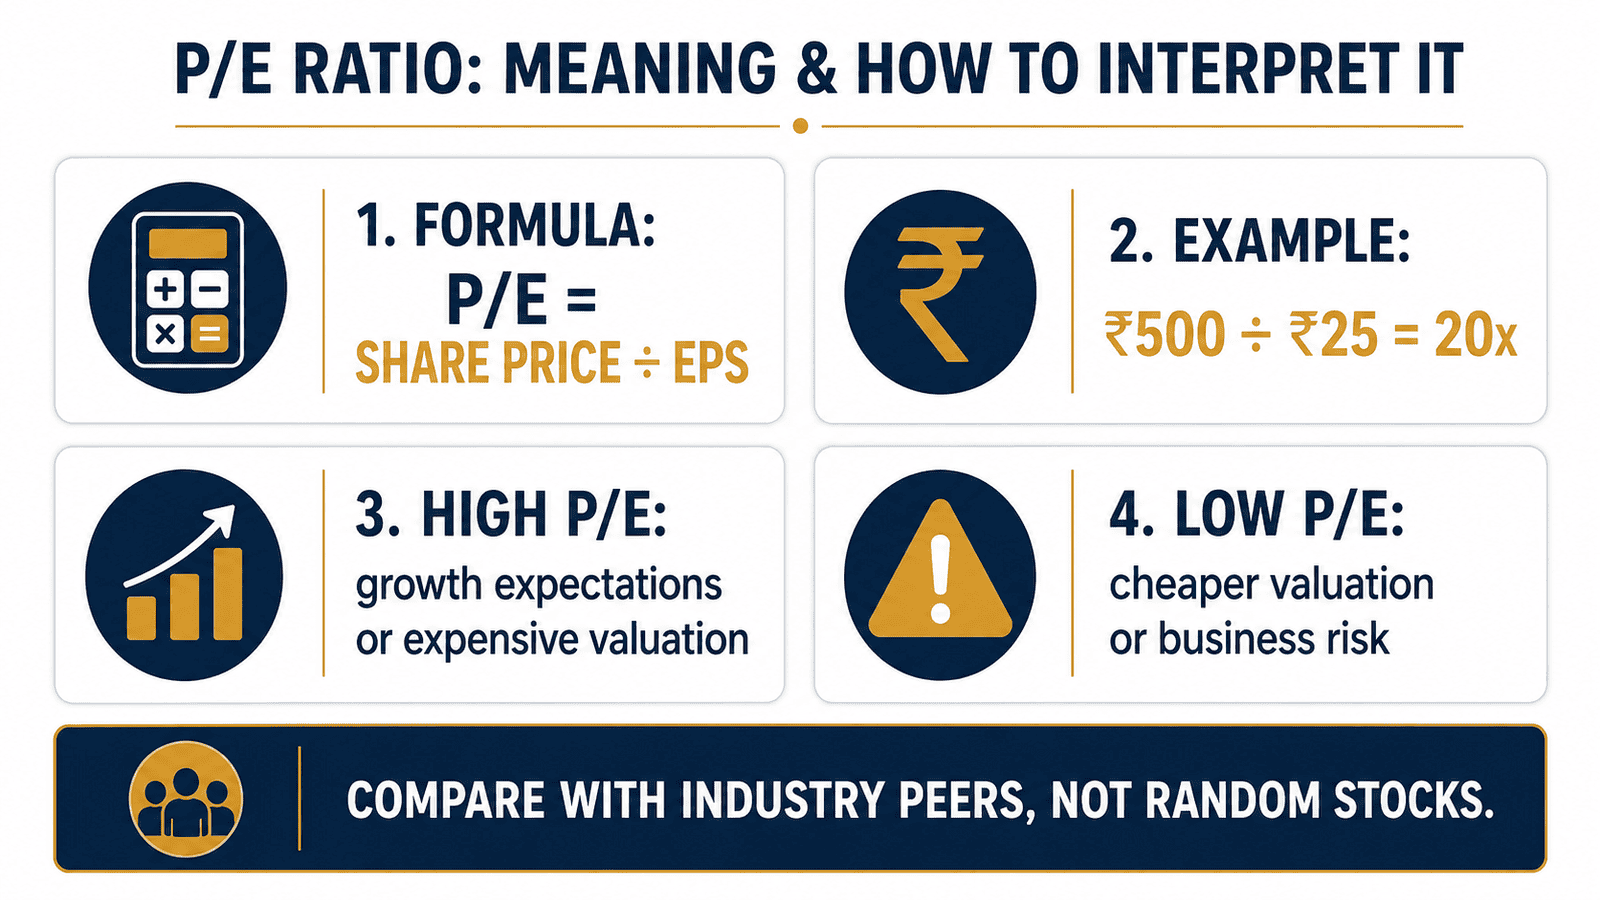
P/E ratio meaning is the relationship between a company’s share price and earnings per share, showing how much investors pay for ₹1 of earnings. If a stock trades at ₹500 and EPS is ₹25, its P/E is 20x. It helps compare valuation but should not be used alone.
Key Takeaways
- P/E ratio = market price per share ÷ earnings per share (EPS). A P/E of 20 means investors are paying ₹20 for every ₹1 of annual earnings.
- A high P/E (say 60x) does not automatically mean overvalued — it can reflect high growth expectations for the company’s future earnings.
- A low P/E (say 8x) does not automatically mean cheap — it can signal weak earnings quality, business risk, or a declining industry.
- Trailing P/E uses actual past earnings; forward P/E uses analyst estimates of future earnings. Both have limitations.
- Always compare P/E within the same industry. A P/E of 25x is unremarkable for a software company but high for a commodity producer.
- P/E breaks down completely for loss-making companies, cyclical businesses during profit peaks, and firms with one-time gains distorting EPS.
- P/E is a starting point for stock analysis — not a buy or sell decision on its own.
Key Facts at a Glance
| Parameter | Detail |
|---|---|
| Full name | Price-to-Earnings Ratio |
| Formula | Current Share Price ÷ Earnings Per Share (EPS) |
| Output unit | Written as a multiple — e.g. 20x, 30x, 60x |
| Best used for | Profitable companies with stable, recurring earnings |
| Weak for | Loss-making, cyclical, or one-time-profit companies |
| What “20x” means | Investors pay ₹20 today for every ₹1 of annual earnings |
| Must be compared with | Sector average P/E, company’s own historical P/E, earnings trend |
| Does not consider | Debt level, cash flow quality, business moat, promoter quality |
What Is P/E Ratio Meaning — Explained from Scratch
The price-to-earnings ratio answers a simple question: for every ₹1 this company earns annually, how much are investors willing to pay in the market today? That is the entire concept.
To get there, you need two numbers. The first is the current market price per share — the live price at which the stock is trading on NSE or BSE right now. The second is earnings per share (EPS) — the company’s net profit divided by the total number of shares outstanding. When you understand what a share means and how ownership works, the idea of per-share profit becomes straightforward.
EPS Is Not the Same as Dividend
This is where most beginners get confused. EPS is the company’s total profit allocated across each share. A company with a ₹100 crore net profit and 10 crore shares has an EPS of ₹10. Whether it pays that profit out as a dividend or keeps it for growth is a separate decision. EPS is accounting profit per share — dividends are what shareholders actually receive in hand. The P/E ratio uses EPS, not dividend.
Why Share Price Alone Tells You Nothing About Value
Suppose Company A trades at ₹200 and Company B trades at ₹1,200. Most beginners instinctively think Company A is cheaper. But if Company A earns ₹5 per share and Company B earns ₹80 per share, their P/E ratios are 40x and 15x respectively. At that point, Company B is the one trading at a relatively modest valuation multiple and Company A is the one demanding a premium. Price without earnings context is just noise.
Why P/E Changes Over Time
P/E is not fixed. It moves every trading day because share price moves constantly. It also shifts every quarter when the company reports new earnings. A company whose profits grow faster than its share price will see its P/E shrink. A company whose share price runs ahead of earnings growth will see its P/E expand. According to SEBI’s investor education material, understanding what drives price changes — including earnings revisions — is fundamental to informed investing.
How to Open a Demat Account Before Using These Metrics
If you are reading about P/E because you have recently started exploring direct equity investing, the first practical step is opening a demat account. Stock valuation ratios only become relevant once you have access to markets.
Trailing P/E vs Forward P/E
When a stock app shows you a P/E number, it is almost always the trailing P/E — calculated using actual earnings from the past twelve months (also called TTM, or trailing twelve months). This uses confirmed, audited figures.
Forward P/E uses analyst estimates of what the company is expected to earn over the next twelve months. Forward P/E is often lower than trailing P/E for growing companies — because analysts expect earnings to rise. But estimates can be wrong. A company that misses its earnings forecast will see its actual P/E come out higher than the forward P/E suggested. Both versions are useful; neither is perfectly reliable on its own.
Real Example: Two Indian Companies, Two Very Different Stories
Let us use two fictional companies to make this concrete.
Company Alfa is a mid-sized consumer goods firm. Its share price is ₹500. Its earnings per share for the trailing twelve months is ₹25. P/E = ₹500 ÷ ₹25 = 20x. Investors are paying ₹20 for every ₹1 of annual profit.
Company Beta is a technology platform business. Its share price is ₹900. Its EPS for the trailing twelve months is ₹30. P/E = ₹900 ÷ ₹30 = 30x.
At first glance, Alfa looks cheaper because 20x is less than 30x. But if Beta’s earnings are growing at 40% per year and Alfa’s are flat, investors may be fully justified in paying a premium for Beta’s future earnings. The higher P/E is not automatically a problem — it reflects growth expectations.
Now suppose Beta announces that ₹15 of its ₹30 EPS came from a one-time sale of an office building. Strip that out and Beta’s recurring EPS is only ₹15. Suddenly its P/E on normal earnings is 60x — a very different picture. This is why understanding what is inside the “E” matters as much as the ratio itself.
On the question of dividends: if Alfa pays ₹5 per share as dividend, that does not mean its EPS is ₹5. EPS is total profit per share — ₹25 in this case. The dividend payout basics article explains the difference between profits earned and profits paid out in detail.
How to Calculate P/E Ratio
P/E Ratio = Current Market Price per Share ÷ Earnings Per Share (EPS)
Step 1: Find the current share price from NSE or BSE, or from a registered brokerage app. This changes every second during market hours — use the closing price or last traded price for a stable calculation.
Step 2: Find EPS. For trailing P/E, use the sum of the last four quarterly earnings per share, or the annual EPS from the company’s most recent audited results. For forward P/E, use analyst consensus estimates from financial data providers.
Step 3: Divide price by EPS and express the result as a multiple. ₹500 ÷ ₹25 = 20. Write it as 20x.
What If EPS Is Zero or Negative?
If a company is reporting a loss, its EPS is negative. Dividing a positive price by a negative EPS produces a meaningless or negative P/E. In this case, P/E simply cannot be used. Some platforms show “N/A” or “—” for loss-making companies. Others may display a very large number or a negative sign. None of these are interpretable as a valuation signal. The company needs to return to profitability before P/E becomes useful again.
| Scenario | Key Inputs | P/E Result |
|---|---|---|
| Standard calculation | Price ₹500, EPS ₹25 | 20x |
| Higher-priced, higher-growth stock | Price ₹900, EPS ₹30 | 30x |
| One-time earnings stripped out | Price ₹900, Recurring EPS ₹15 | 60x |
| Loss-making company | Price ₹300, EPS –₹12 | Not meaningful |
Comparison: High P/E vs Low P/E vs Other Scenarios
| P/E Scenario | What It May Indicate | Watch Out For |
|---|---|---|
| High P/E (e.g. 60x–80x) | Market expects strong future earnings growth | If growth does not materialise, price can fall sharply |
| Low P/E (e.g. 6x–10x) | Stock may be undervalued, or market has low expectations | Could reflect genuine business risk, not a bargain |
| Trailing P/E | Based on confirmed past earnings — more reliable | Backward-looking; does not reflect future prospects |
| Forward P/E | Based on earnings estimates — forward-looking | Estimates can be wrong; optimism may be priced in |
| Negative P/E | Company is loss-making | P/E is not usable as a valuation tool here |
| P/E above sector average | Premium valuation relative to peers | May be justified by superior growth or quality |
| P/E below sector average | Discount to peers | May signal weaker fundamentals, not just a bargain |
Understanding market cap categories helps here — large-cap, established businesses typically command lower P/E multiples than small-cap growth companies, simply because of the earnings certainty premium investors assign to scale and track record.
How to Decide What’s Right for You
The stock’s P/E is well below the sector average and the company’s earnings have been stable and growing — THEN it may warrant deeper research as a potentially undervalued candidate.
The stock carries a high P/E but the company has consistently grown earnings at 25–30% per year — THEN the premium may be justified and the comparison you want is P/E versus earnings growth rate, not P/E in isolation.
The stock’s low P/E has been low for several consecutive years with no earnings recovery — THEN this is a value trap signal, not a buying opportunity, and you need to understand why the market continues to discount it.
The company’s current EPS includes a one-time asset sale, insurance payout, or exceptional gain — THEN strip that out and recalculate P/E on normal recurring earnings before drawing any conclusion.
You are comparing two companies across different sectors — say an IT firm and a steel company — THEN do not compare their P/E ratios directly. Sector norms differ significantly; the comparison is meaningless without sector context.
If you are not yet comfortable reading a company’s quarterly earnings report, balance sheet, and cash flow statement — THEN do not use P/E as a standalone buy signal. It is a screening tool that needs fundamental context to be useful. According to SEBI’s investor education guidelines, understanding company financials before investing is strongly encouraged.
Common Mistakes to Avoid
Assuming Low P/E Automatically Means Cheap
A stock with a P/E of 7x can look like a bargain. But if the company operates in a shrinking industry, carries heavy debt, or has management credibility issues, the market may be correctly pricing in risk — not offering a discount. A low P/E on a deteriorating business is not value; it is a warning.
Always check whether earnings are growing, flat, or declining before assuming a low P/E is an opportunity.
Assuming High P/E Automatically Means Overvalued
Many of India’s best-performing companies over the past decade have traded at P/E ratios of 50x–80x for extended periods. Selling them because the P/E looked “too high” would have meant missing substantial compounding. A high P/E reflects market expectation of growth — the question is whether that growth actually comes through.
Compare P/E with the company’s historical earnings growth rate before concluding it is expensive.
Comparing P/E Across Unrelated Sectors
A private sector bank at a P/E of 18x and an FMCG company at 45x are operating in entirely different profit dynamics, capital structures, and regulatory environments. Comparing their P/E ratios directly and concluding the bank is cheaper is a category error. Sector norms exist precisely because businesses have structurally different return and reinvestment profiles.
Ignoring One-Time Profits or Losses in EPS
A company that sells a factory, gets a tax refund, or reverses an old write-off will show a temporarily inflated EPS. This pushes P/E down artificially. If you buy based on that low P/E and next year’s earnings revert to normal, you will find you overpaid on a normalised basis. Always check the earnings notes for exceptional items.
Using P/E for Loss-Making Companies
If EPS is negative, P/E is not calculable in any useful sense. Some apps display a negative P/E or a very large number — neither is interpretable. For early-stage or loss-making businesses, analysts typically use other metrics such as Price-to-Sales or EV/EBITDA. Trying to force P/E onto these situations leads to bad decisions.
Treating P/E as a Standalone Buy Signal
P/E is a starting point, not a verdict. A stock can have an attractive P/E and still be a poor investment if debt is unsustainable, promoter holding is falling, or competitive moat is eroding. Use P/E to shortlist, then do the deeper work.
When This May Not Be the Right Choice
Loss-making companies: If a company is reporting net losses, its EPS is negative and P/E produces no usable output. Beginners who apply P/E here will either get a confusing number or no number at all — and neither helps them evaluate the stock.
Cyclical businesses: Steel, cement, chemicals, and commodity companies go through sharp profit cycles. At the top of a cycle, earnings are high and P/E looks deceptively low. At the bottom, losses make P/E useless. For cyclical stocks, analysts typically look at through-the-cycle averages or enterprise value metrics instead.
Companies with large one-time events: An asset disposal, a tax credit, or a litigation settlement can cause EPS to spike in a single year. The resulting low P/E is artificial. If you buy on it, the next year’s “normal” earnings will reveal the true picture.
Early-stage growth companies: Many high-quality businesses — particularly in technology and consumer platforms — choose to invest heavily in growth rather than show current profits. Their EPS is low or zero by design. P/E either does not apply or produces an extreme number that misleads rather than informs.
If any of these apply to your situation, it may be worth exploring alternatives before committing.
Official Rules and Where to Verify
P/E ratio is not a regulated concept — there are no official government rules about what P/E range makes a stock investable. What is official and verifiable is the underlying financial data that feeds the calculation.
- SEBI (sebi.gov.in): India’s securities market regulator. Its investor education section explains financial ratios and provides guidance on informed investing. SEBI requires listed companies to disclose audited financial results quarterly.
- NSE (nseindia.com): National Stock Exchange of India. Lists company financial results, announcements, and quarterly earnings reports. You can find EPS data for NSE-listed companies from their filing disclosures.
- BSE (bseindia.com): Bombay Stock Exchange. Same function as NSE — company filings, earnings results, and investor announcements are accessible here.
Note that brokerage apps and financial data platforms may display P/E ratios that differ slightly from each other, depending on whether they use TTM EPS, forward estimates, diluted EPS, or standalone versus consolidated earnings. Always check which version a platform is using before comparing figures across sources.
Before you move from learning valuation ratios to actual stock investing and selling, understanding stock tax rules in India — including STCG, LTCG, and STT — is an important practical step.
Rules, limits, and rates on this topic can change with each Budget or regulatory update. Always verify current figures directly from the official source before making any financial decision.
Expert Tips
- Always ask what is inside the “E”: Before accepting a P/E at face value, check whether the EPS used is recurring and normalised, or whether it includes exceptional items. A P/E of 12x on inflated earnings is not actually 12x on a forward basis.
- For banks and NBFCs, add more metrics: Financial companies have complex balance sheets. NPA ratios, return on assets, and price-to-book value tell you things P/E cannot. Use P/E alongside these — not instead of them.
- Compare a company’s P/E to its own history: A company that has historically traded at 30x and is now at 15x may genuinely be cheaper relative to its own earnings track record. Context from the company’s own past is often more useful than industry averages alone.
- For fast-growing companies, look at P/E relative to growth (PEG): Dividing P/E by the expected annual earnings growth rate gives the PEG ratio. A P/E of 60x with 60% earnings growth gives a PEG of 1 — arguably more attractive than a P/E of 20x with 5% growth (PEG of 4). This is not a definitive metric but adds context.
- For cyclical sectors, use trough earnings, not peak earnings: If you are evaluating a metals or commodity company at the top of a profit cycle, use a normalised or through-the-cycle EPS estimate, not the most recent high print. Peak-earnings P/E can look deceptively cheap right before a downturn.
- One P/E check is not enough — recheck after every quarterly result: EPS changes every quarter. A P/E of 22x before results can become 30x if earnings disappoint. Build the habit of recalculating after each quarterly announcement rather than relying on a stale number from a stock app.
Frequently Asked Questions
What is P/E ratio in simple words?
P/E ratio tells you how much money investors are paying today for ₹1 of annual profit from a company. If the P/E is 25, investors are paying ₹25 for every ₹1 of earnings. It is a way to compare whether a stock’s price is high or low relative to what the company actually earns.
What is a good P/E ratio for Indian stocks?
There is no universal answer. What counts as a reasonable P/E depends on the sector, the company’s growth rate, and market conditions. A P/E of 15x may be fair for a slow-growth utility company and low for a technology company growing at 30% per year. The comparison that matters is the company’s P/E versus its sector peers and its own historical range — not a fixed number.
Is a high P/E ratio bad?
Not necessarily. A high P/E typically means investors expect the company’s earnings to grow substantially in the future. If that growth materialises, the high P/E today may look justified in hindsight. The risk is that if earnings disappoint, a high-P/E stock can fall sharply because the premium built in for growth disappears. High P/E demands higher earnings delivery — that is the trade-off.
Is a low P/E ratio always a buying opportunity?
No. A low P/E can reflect genuine undervaluation — or it can reflect the market’s well-founded scepticism about the company’s future. Persistent low P/E without any earnings recovery or positive catalyst is often called a value trap. Research why the P/E is low before concluding it is cheap.
What is the difference between trailing P/E and forward P/E?
Trailing P/E uses actual earnings from the past twelve months — confirmed numbers from company results. Forward P/E uses analyst estimates of earnings over the next twelve months — projections that can be revised or missed. Trailing P/E is more reliable factually; forward P/E is more relevant for future-oriented decisions, but comes with estimation risk.
Can P/E ratio be negative?
Mathematically, yes — if EPS is negative (company is loss-making), dividing a positive share price by a negative EPS produces a negative number. But a negative P/E has no practical interpretive value. It simply tells you the company is currently unprofitable. P/E should not be used as a valuation tool for loss-making companies.
Should I buy a stock only because its P/E is low?
No. P/E is a useful screening filter but not a buy signal on its own. A low P/E stock may have poor earnings quality, high debt, declining revenues, or management issues that fully explain the discount. Before acting on P/E, also check the earnings trend, debt levels, sector conditions, and business fundamentals.
How is P/E different from EPS?
EPS (earnings per share) is the company’s net profit divided by the number of shares — it is a measure of profitability. P/E is the share price divided by EPS — it is a measure of valuation. EPS tells you how much the company earns; P/E tells you how much the market is charging you to own a piece of those earnings.
Can I start tracking P/E without opening a demat account?
Yes — you can read P/E ratios on financial websites and exchanges without investing. But to actually apply this knowledge to buying stocks directly, you will need to go through the process of opening a demat account first. Tracking P/E passively is a good way to build familiarity before committing capital.
Does P/E ratio apply to mutual funds?
Mutual funds themselves do not have a P/E ratio in the same sense as individual stocks. However, equity mutual funds publish a portfolio P/E — the weighted average P/E of all the stocks the fund holds. This gives you a broad sense of whether the fund’s portfolio is invested in relatively high-valuation or low-valuation stocks. It is a useful reference but not a direct indicator of fund performance.
Final Verdict
P/E ratio meaning is straightforward at its core — it is the price investors pay per rupee of earnings. But using it well is where most beginners stumble. A P/E of 60x is not automatically alarming, and a P/E of 8x is not automatically a gift. The ratio only becomes useful when you compare it with the company’s sector peers, its own historical range, and the quality of the earnings that form the denominator. For loss-making companies, cyclical businesses, and firms with one-time earnings, P/E either breaks down or actively misleads. Treat it as one checkpoint in a broader research process, not a verdict on its own. Understanding market cap categories alongside valuation ratios will give you a more complete picture of what you are evaluating. Always verify the latest rules from official sources or consult a qualified professional before making any financial decision.
This article is for educational purposes only and should not be treated as personalised financial, tax, investment, insurance, or legal advice. Tax rules, interest rates, regulatory limits, and product features can change with each Budget or policy update. Please verify current rules from official government sources or consult a qualified and registered professional before making any financial decision. Mutual fund investments are subject to market risks. Past performance does not guarantee future returns. Stock market investments are subject to market risk. The P/E ratios and share price examples used in this article are illustrative and fictional — they do not refer to any specific listed company or constitute a recommendation to buy or sell any security.

Devika Shah writes about stock market basics for Indian beginners who want to understand equity investing before taking financial risk. Her content is educational and does not provide stock tips, trading calls, price predictions, or personalised investment advice.
She covers topics such as demat account meaning, trading account basics, IPOs, dividends, brokerage charges, delivery vs intraday trading, market orders, limit orders, stock indices, blue-chip stocks, capital gains tax, stock market terminology, risk management, and the difference between long-term investing and short-term speculation.
Devika’s writing is clear, balanced, and risk-conscious. She helps readers understand how the stock market works, what accounts and documents are needed, what charges may apply, and what mistakes beginners should avoid. Her articles are suitable for students, salaried employees, and first-time investors who want a foundation before investing. Since market rules, tax treatment, brokerage fees, IPO processes, and regulatory requirements can change, readers should verify current information from SEBI, exchanges, brokers, and official tax sources.